Process Data
This is the moment LEO100 stops being a set of components and becomes a receiver. You'll watch satellites get acquired and tracked, then see the resulting position fix appear on the map.
You're done when PpRx reports a position fix on both your post-processed .bin (recorded in the previous tutorial) and a live RadioLion stream. That proves the full path, from RF samples to a PVT solution, works end-to-end on your host.
Overview
Once PpRx has been configured in the GUI, it can process both captured and live RF data.
Configuring the PpRx RF data input is done within the Input/Output (I/O) Overlay.
After PpRx has been properly configured, the Run PpRx button will be enabled.
PpRx can be run without output products specified. For this tutorial, leave output products disabled.
Running PpRx on Captured Data (Post-Process)
To configure PpRx for post-processing within the GUI:
- Within the
Data Inputsection of the I/O Overlay, selectMode: Post-Processing. - Select a
.binfile containing captured raw RF data from a RadioLion device. - Choose to enable or disable the
Simulate RealtimePpRx option. Press the?button to open an info dialog on this setting.
Press the Run PpRx button. PpRx will begin processing the captured data file.
Live diagnostic information will be displayed in the GUI.
Running PpRx on Live Data
To configure PpRx for live processing within the GUI:
- Within the
Data Inputsection of the I/O Overlay, selectMode: Live Processing. - Verify a RadioLion device is connected to the host computer and
RadioLion: Connectedis displayed in the GUI.
Press the Run PpRx button. PpRx will begin streaming and processing live RF data from the RadioLion.
After a few seconds, if the RadioLion status does not show Connected, see Troubleshooting Tips.
Navigating the GUI Window
The GUI displays receiver diagnostic information while it is running. Raw Receiver Time (RRT) will appear first in the bottom information bar. RRT refers to the time since the start of the run.
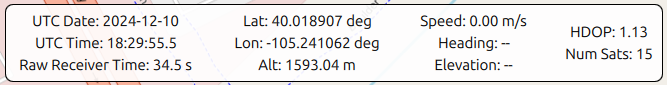
As satellites are acquired and tracked, the number of unique satellites is updated. Timing, position, and other information is displayed as it becomes available. Position is displayed on the map with a 95% confidence ellipse, and a ground track is drawn for the preceding 30 seconds. An altitude plot over time is also displayed.
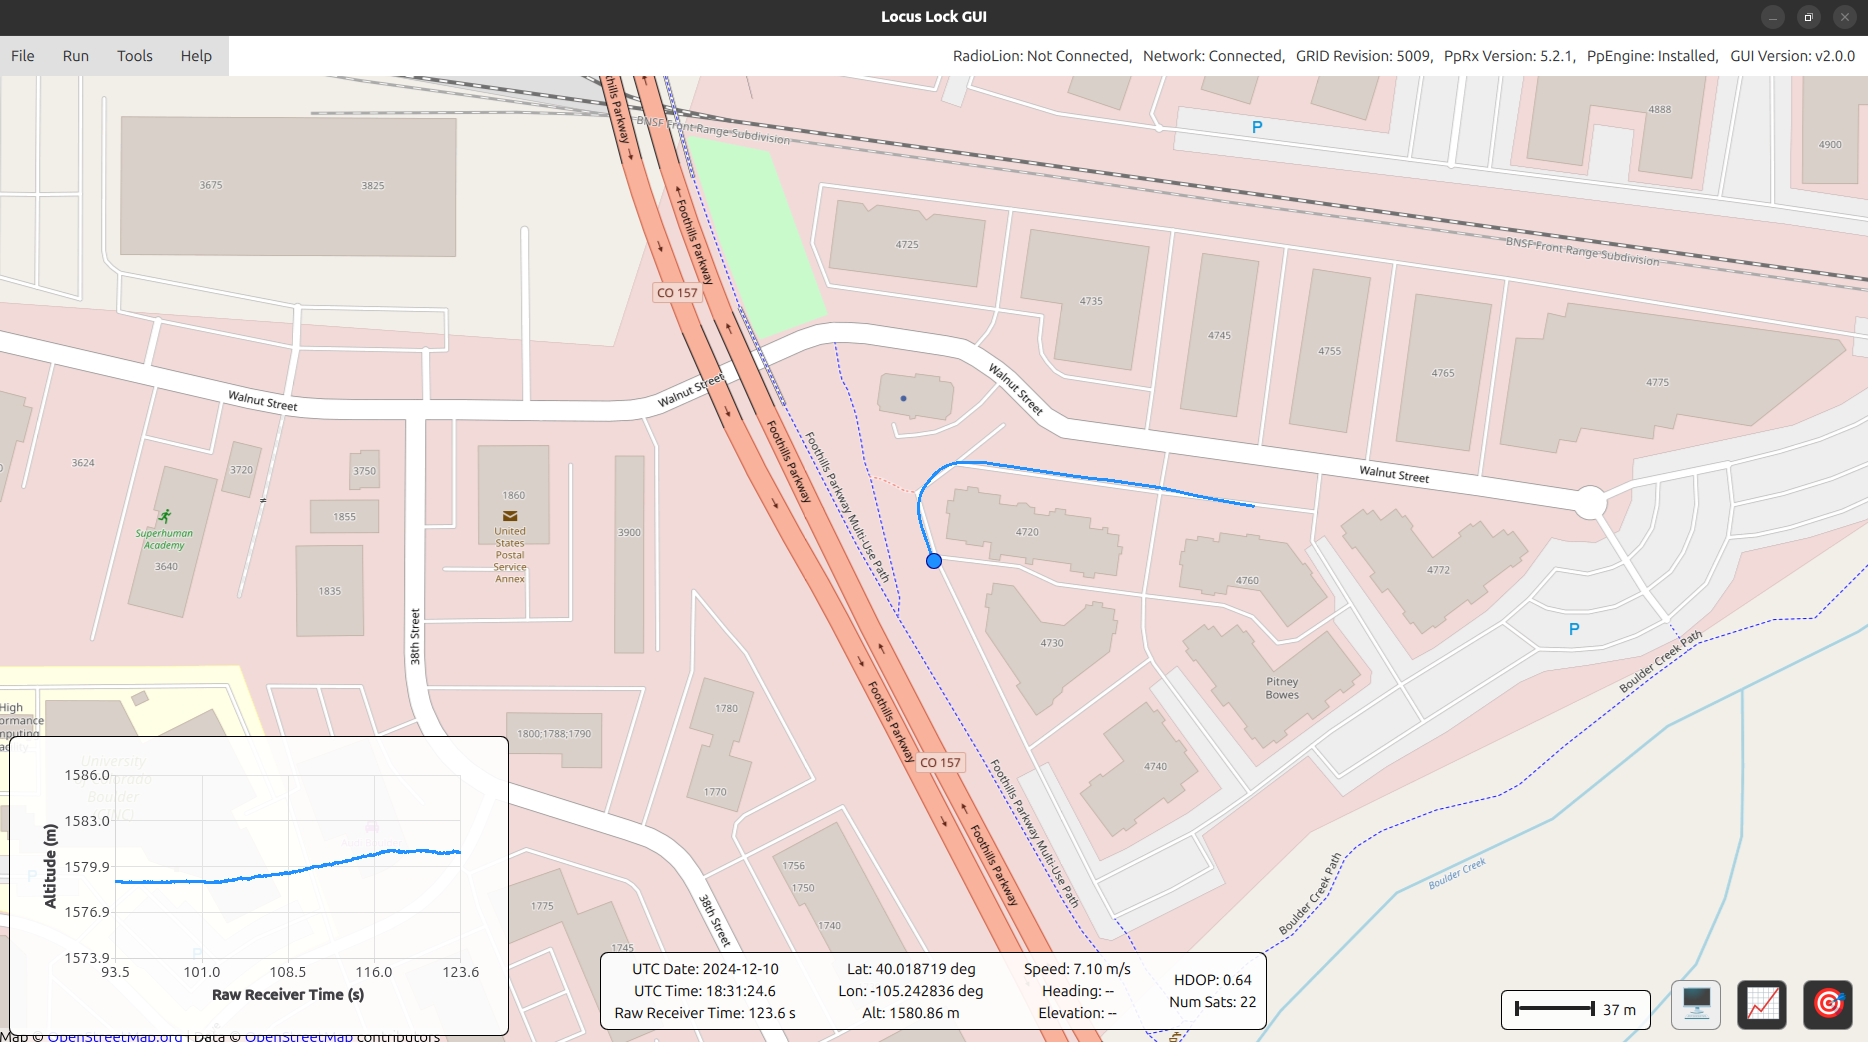
I/O overlay visibility, altitude plot visibility, and map locking can be toggled using the buttons in the bottom right of the GUI window.
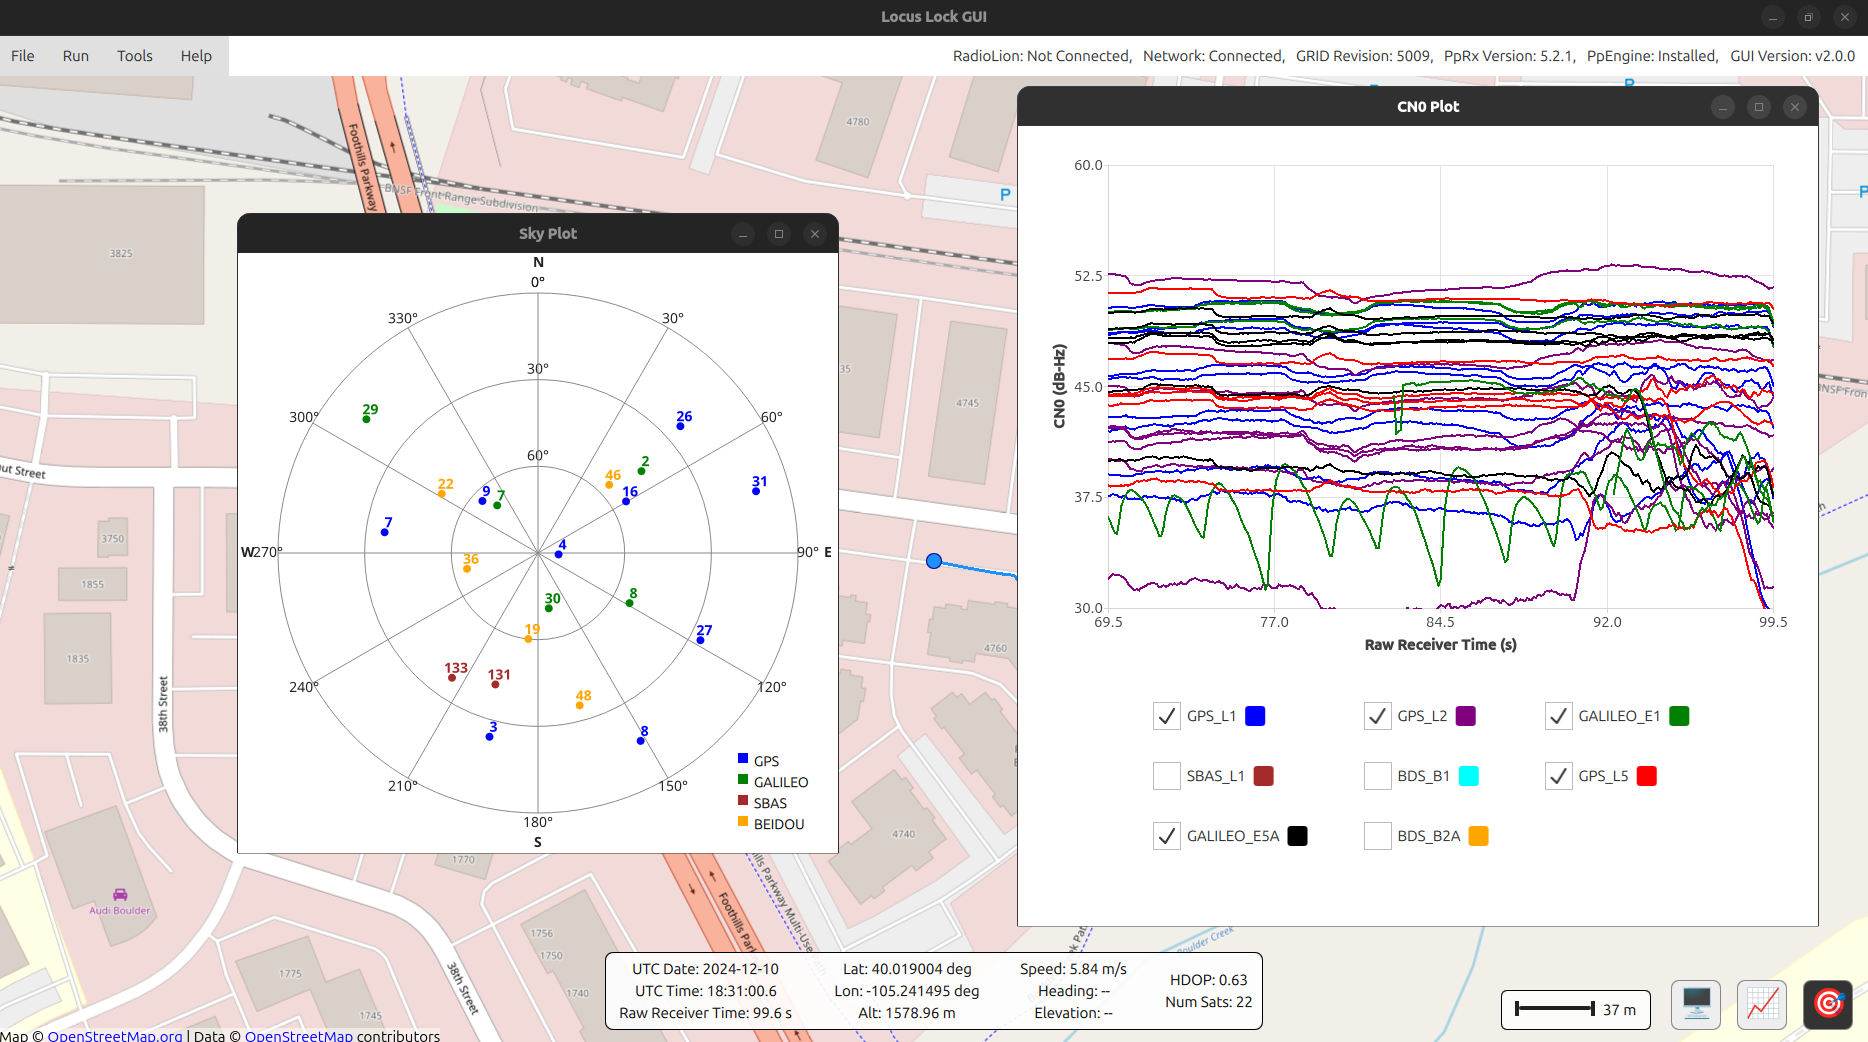
Various informative displays can be found under the Tools menu. Shown below are sky and C/N0 plots.
Where you're at in the Setup Journey
You've completed the linear "first fix" arc: a configured PpRx, running against both recorded and live RF, producing a position solution on your host. That's the foundation everything from here on out will build on. Next up in the Setup Journey is Phase 4 (Advanced Tutorials), where you'll pick from a menu of tutorials to scope and run your evaluation.